Managing daily project schedules can be challenging, especially when multiple tasks and deadlines overlap. A Gantt chart helps visualize your project’s timeline and progress in an intuitive way. This free Excel template provides a simple, automated solution to create daily Gantt charts with just a few clicks.
Built with VBA macros, the chart automatically draws task bars based on your input data—such as task name, start and end dates, progress rate, and status. It’s designed for business professionals, educators, and personal planners who want a clear, printable schedule to track projects effectively.
Whether you’re managing a team, planning a marketing campaign, or organizing daily work routines, this Excel Gantt chart helps you stay on top of your schedule and keep your projects running smoothly.
What is a Gantt Chart?

What is a Gantt Chart?
A Gantt chart is a type of bar chart used to illustrate a project schedule.
It visually represents tasks along a timeline, showing when each task starts, how long it lasts, and when it is expected to finish.
This makes it easier to understand the sequence of activities and how they overlap.
Originally developed by Henry L. Gantt in the early 1900s, the Gantt chart has become one of the most widely used tools in project management.
Today, it remains essential for planning, scheduling, and tracking projects across industries—from software development to education and construction.
How a Gantt Chart Is Used
A Gantt chart helps managers and team members track project progress in real time.
It allows you to identify delays, balance workloads, and coordinate multiple tasks simultaneously.
When combined with progress rates, assignee lists, and non-working days, it provides a complete overview of project performance.
In business environments, Gantt charts are commonly used for project scheduling, event planning, marketing campaigns, and even personal goal tracking.
With Excel, creating and maintaining a Gantt chart becomes both simple and highly customizable.
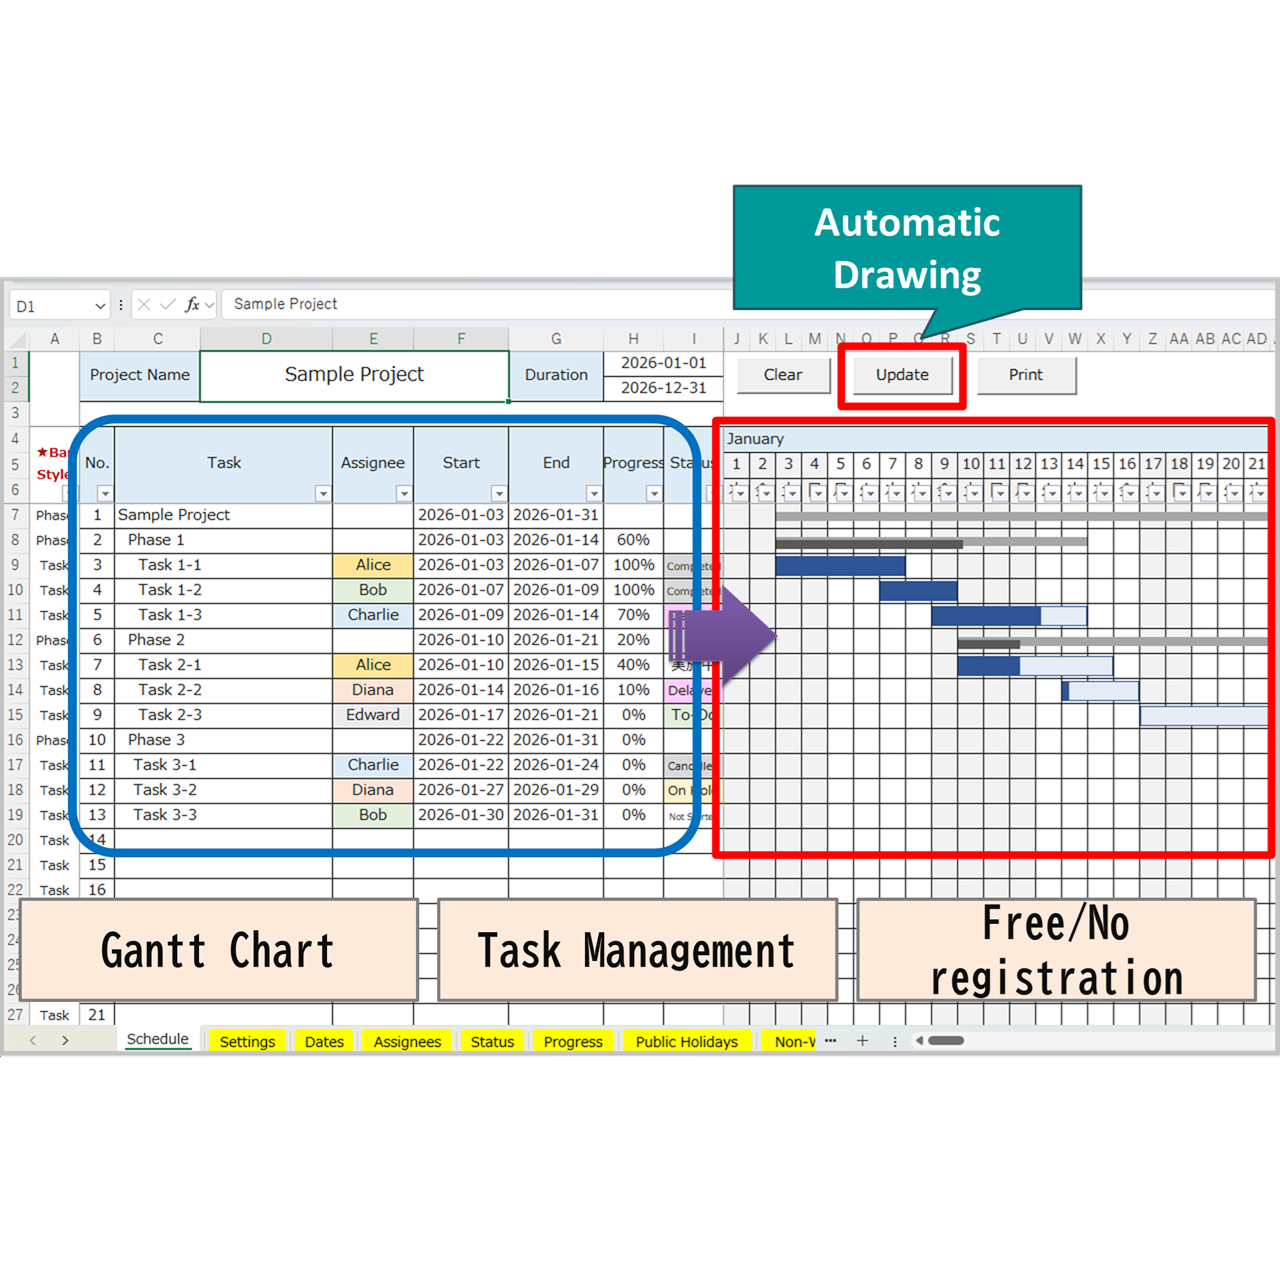
Template Overview|Daily Gantt Chart with Auto-Drawing
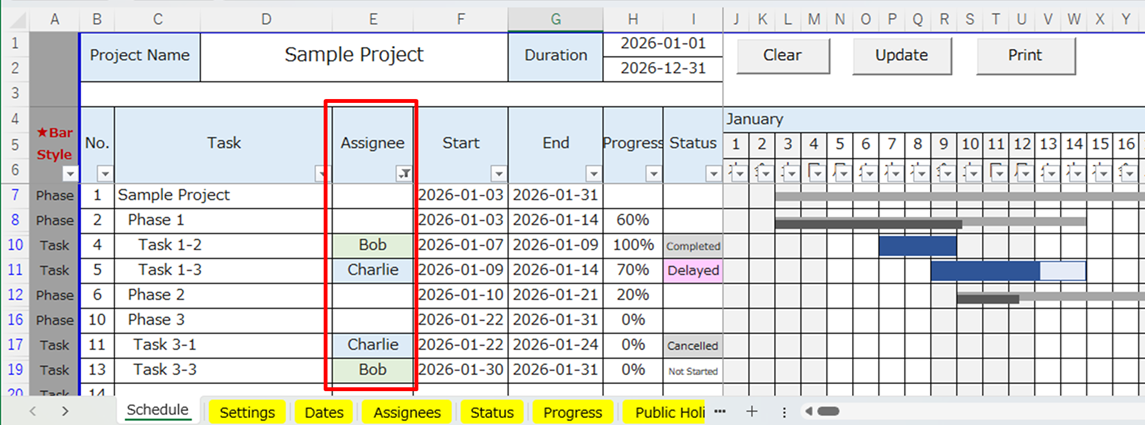
This Excel Gantt Chart template helps you visualize and manage your project timeline on a daily basis.
It automatically draws Gantt bars based on your input data — such as start and end dates, task names, and progress rates.
Built with VBA macros, it makes scheduling faster, clearer, and more accurate.
Main Features
- 📅 Daily-based schedule view — Ideal for short-term projects and detailed daily tracking.
- ⚙ Automatic bar drawing with VBA macros — Task bars are generated automatically from your data.
- 🧩 Editable structure — Update task names, assignees, dates, and progress anytime.
- 🎨 Color-coded visualization — Each assignee and status can be color-customized for better readability.
- 🖨 Print-ready layout — Designed to fit neatly on A4 pages for business use.
Key Features
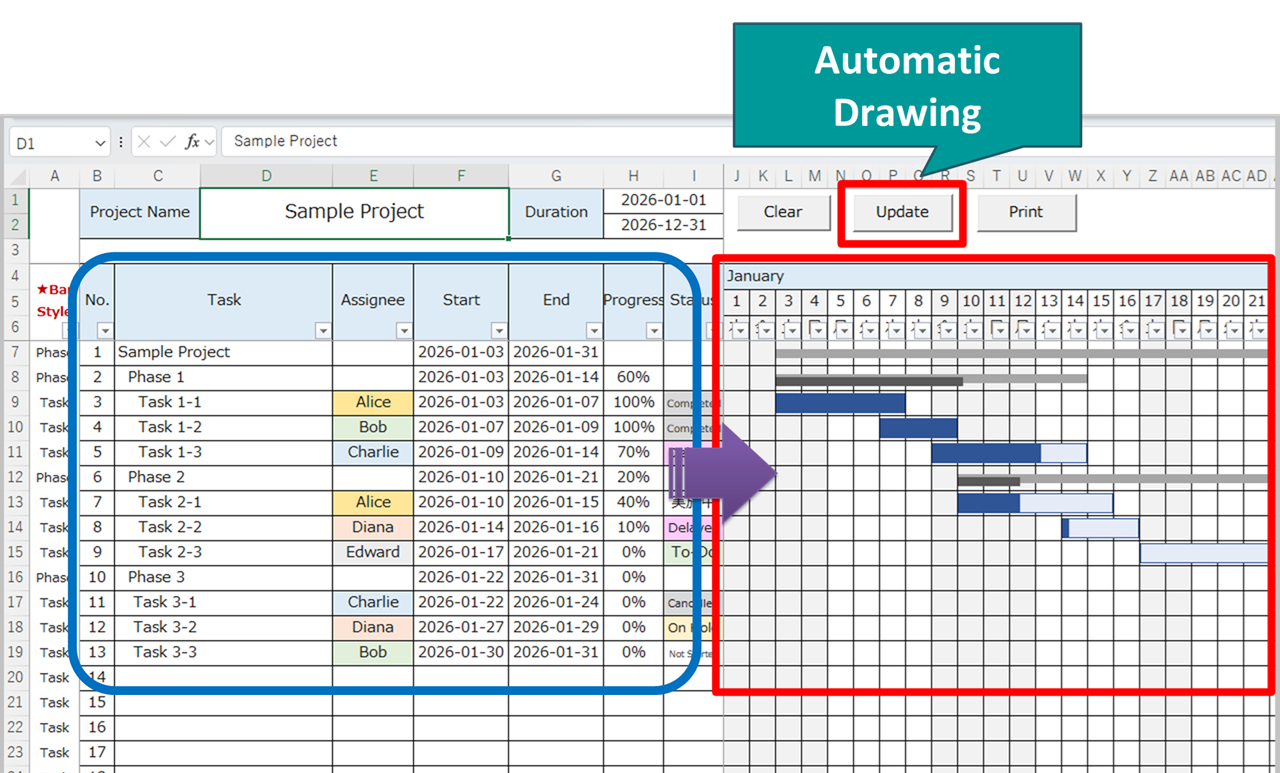
Auto-draw Gantt bars from your data
The chart automatically generates task bars based on your input dates and progress.
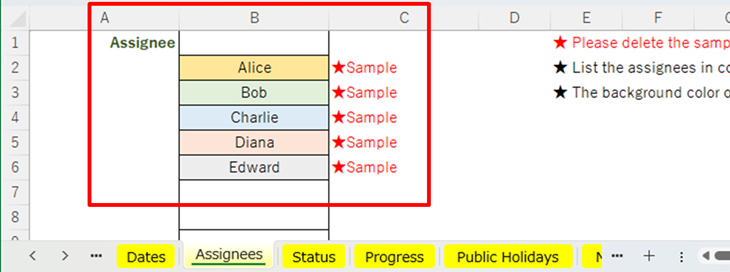
Manage your list of assignees
Keep all team members organized and color-coded for clear task ownership.
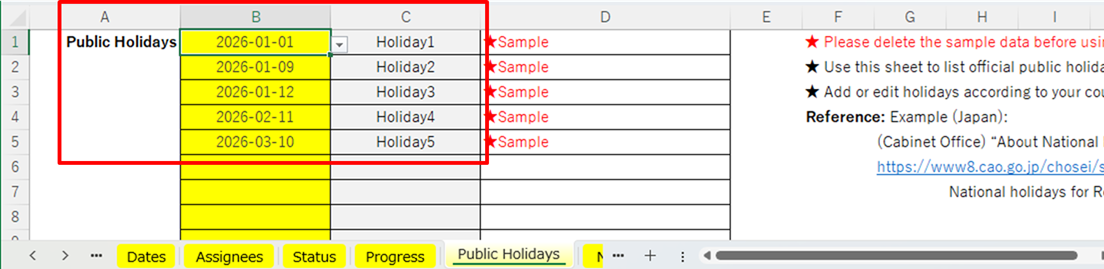
Add public holidays and non-working days
Easily exclude official or private off-days from your project schedule.
Filter by assignee, start date, end date, progress, or status
Quickly narrow down the tasks you want to display in the chart.
English Excel Gantt Chart Templates
Looking for more Excel Gantt chart templates?
This page lists all English Gantt chart templates currently available on Excel-NEXT.
Each template is free to download and designed for practical project planning, from detailed schedules to high-level roadmaps.
Choose the format that best matches your planning needs.
-
Daily Gantt Chart (VBA Auto-Drawing)
A macro-enabled daily Gantt chart that automatically draws bars from schedule data for fast updates. -
Daily Gantt Chart (Manual, Macro-Free)
A simple, macro-free daily Gantt chart you can fill in manually—safe and easy to use in most work environments. -
Hourly Gantt Chart (Daily Time Schedule & Event Timetable)
An hourly Gantt-style schedule for daily planning, staff shifts, and event timetables with 30-minute time blocks. -
Weekly Gantt Chart (Manual, Macro-Free)
A weekly Gantt chart for tracking projects by week, ideal for short- to mid-term planning and reporting. -
Monthly Gantt Chart (Manual, Macro-Free)
A monthly roadmap-style Gantt chart with early/mid/late month blocks, suitable for long-term planning and portfolio views. -
Quarterly Gantt Chart (Annual Project Roadmap)
A quarterly Gantt chart with monthly blocks, designed for annual planning and high-level project roadmaps on a single page.
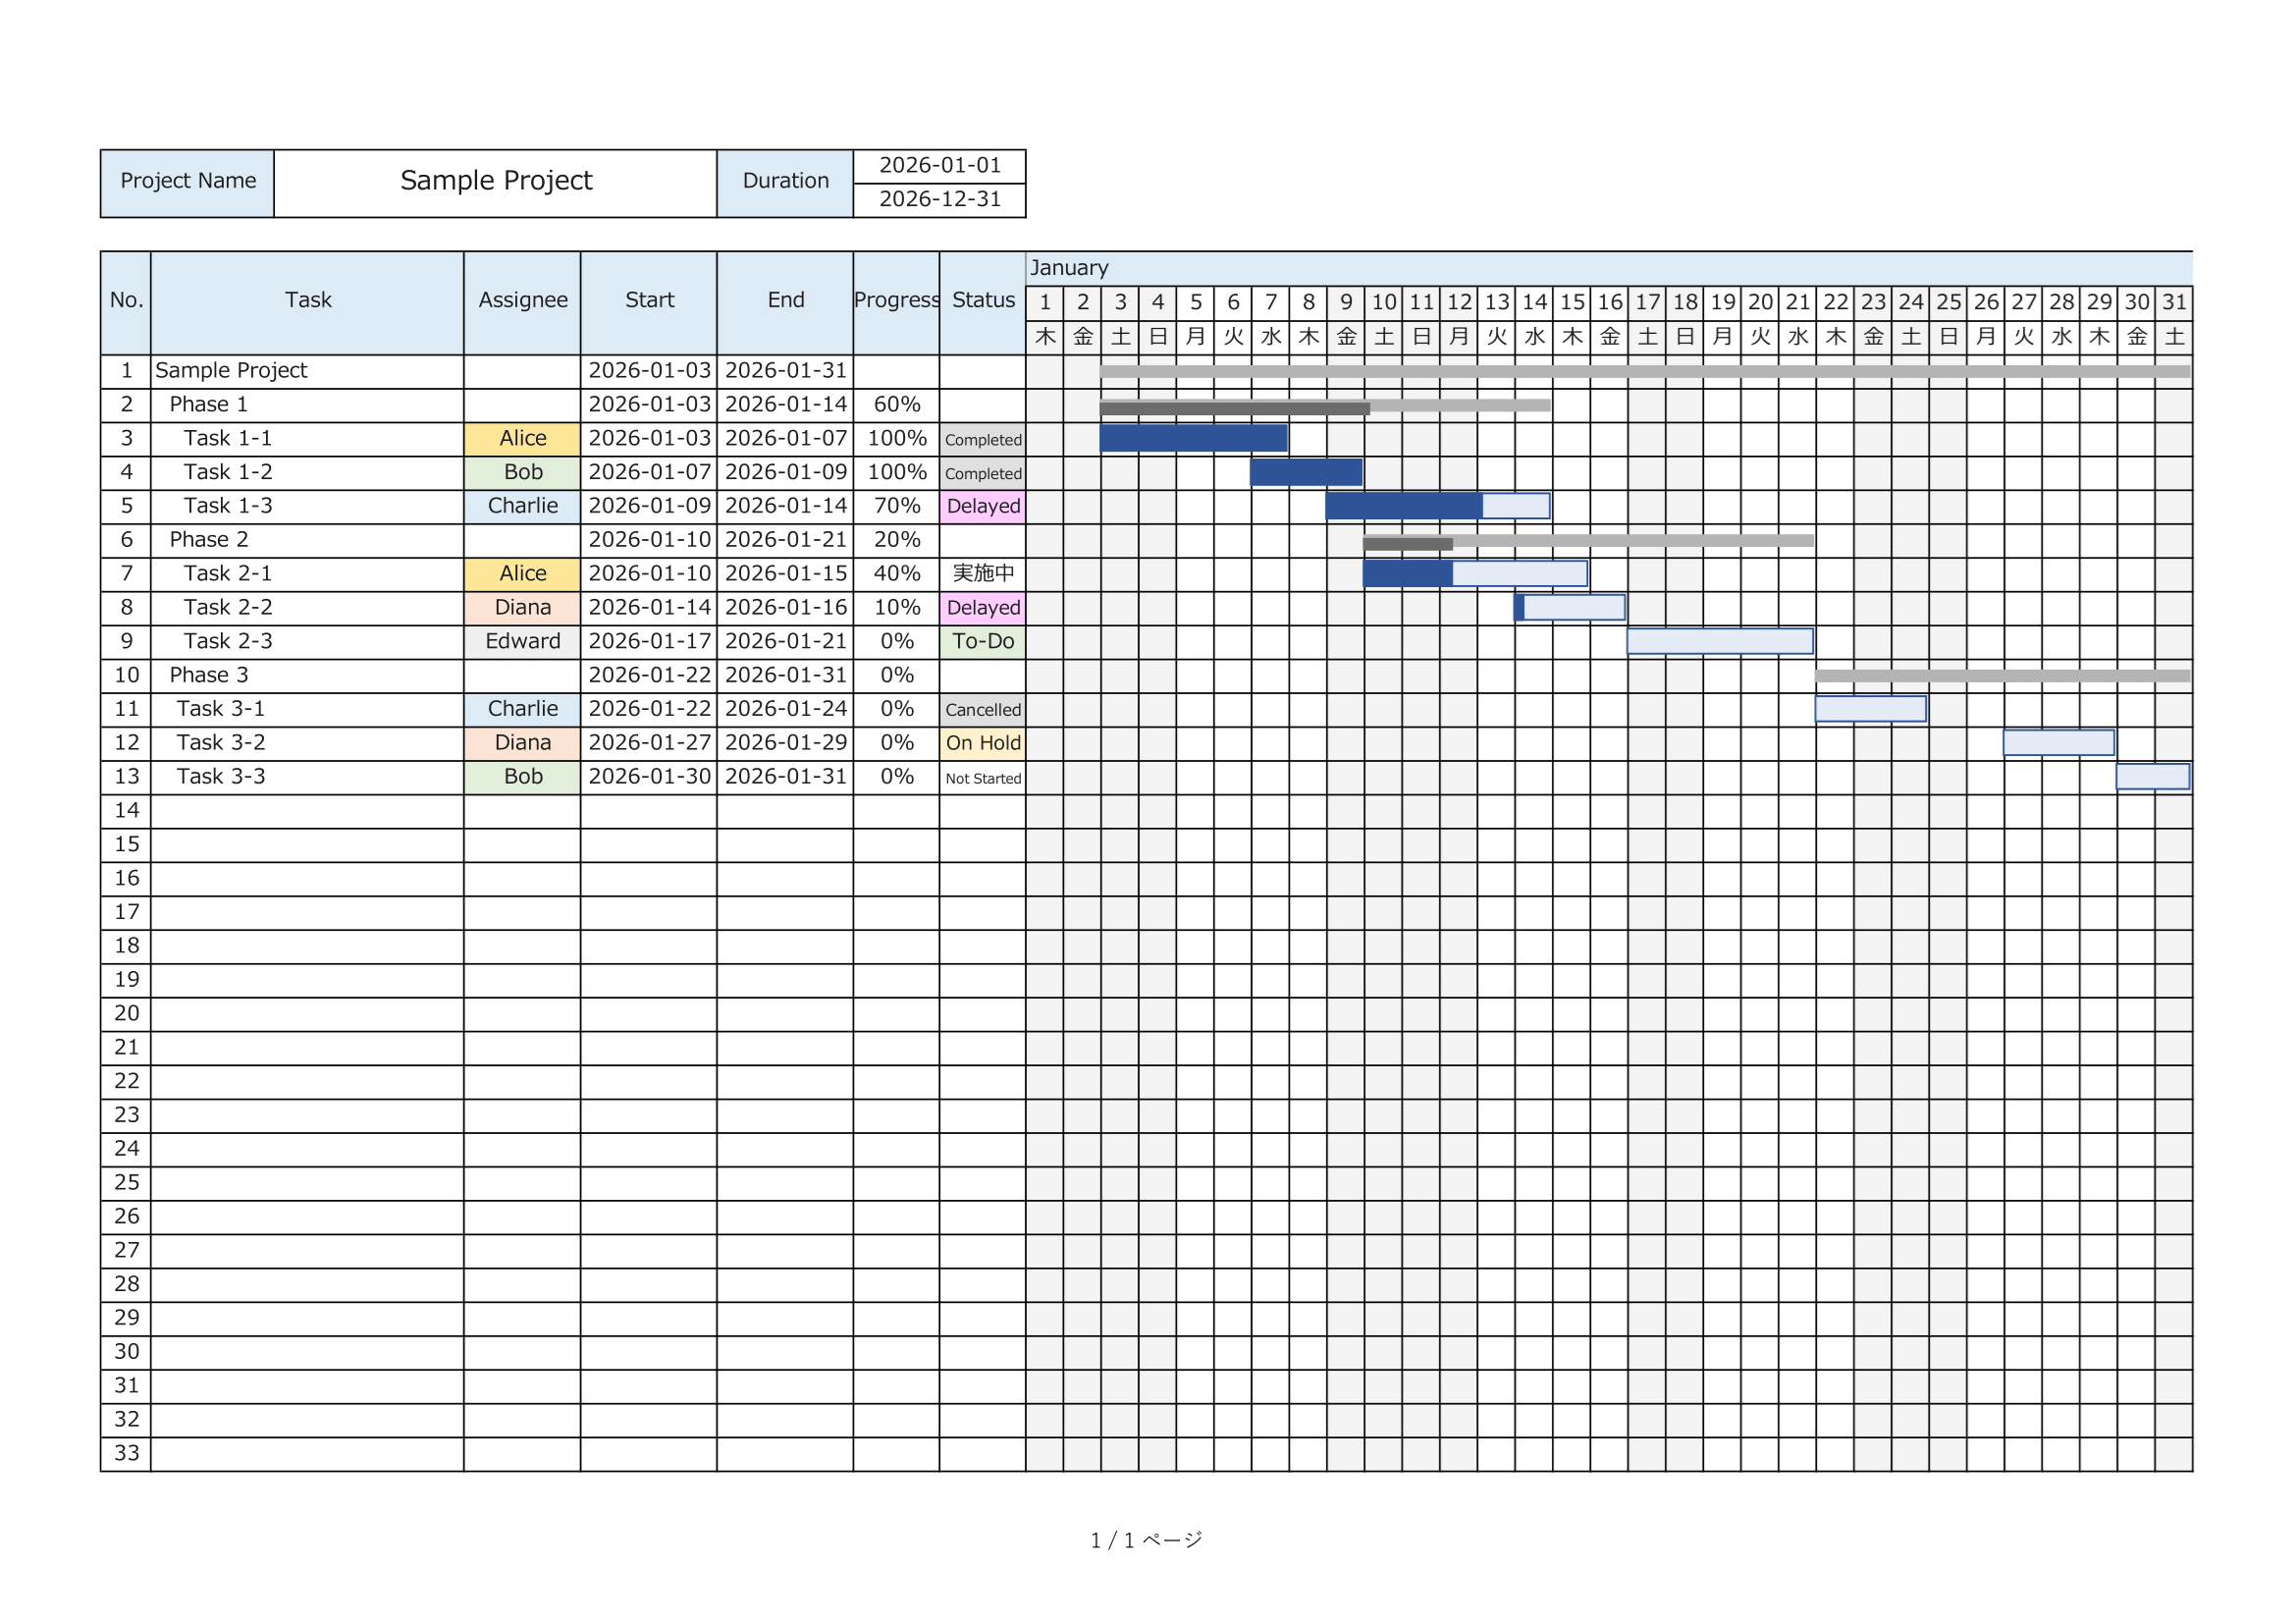
Tip: If you are new to Excel Gantt charts, start with a sample template first.
Sample data helps you quickly understand how to structure schedules and visualize timelines effectively.
Download – 2026 Excel Gantt Chart Templates
With Sample Data
Includes example tasks and prefilled settings so you can quickly see how the chart works.
(Recommended for first-time users.)
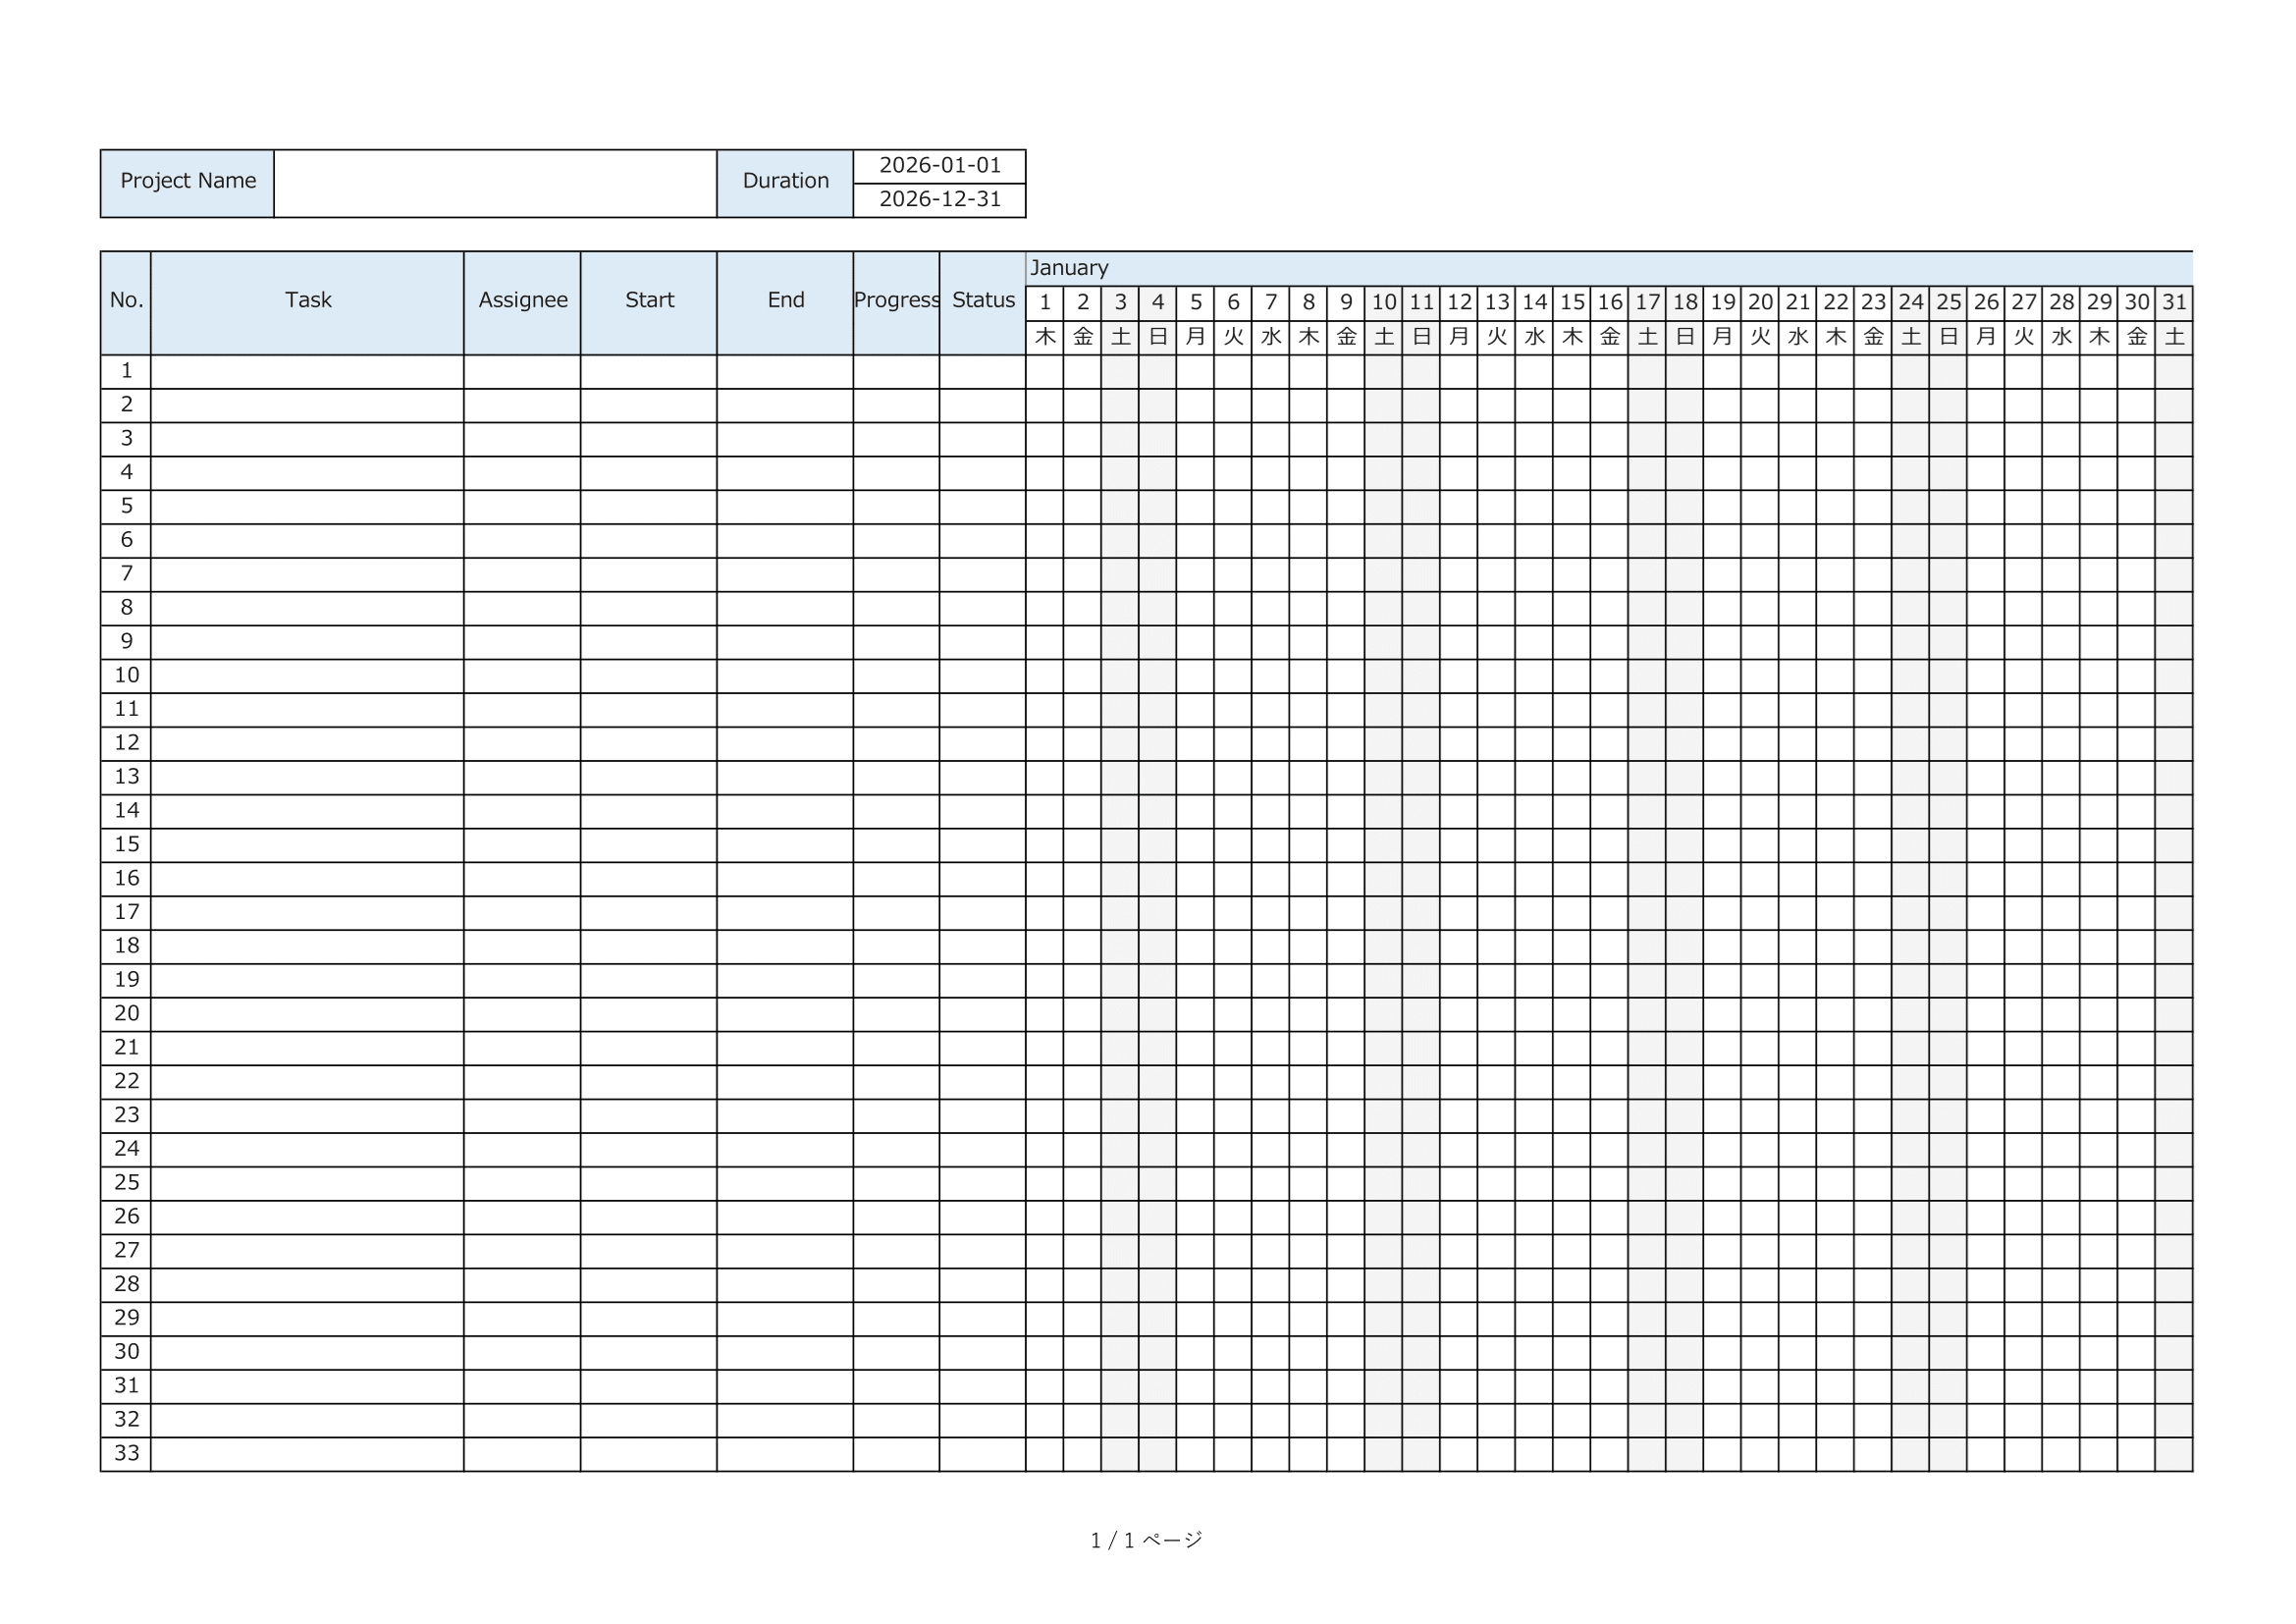
Blank Template
A clean version with no sample data.
Ideal for creating your own project schedule from scratch.
⚠ Disclaimer
This template is provided as-is, without any warranties or guarantees of accuracy, reliability, or fitness for a particular purpose.
The creator assumes no responsibility for any losses or damages resulting from its use.
Redistribution, resale, or modification of this file for commercial purposes is strictly prohibited.
Tips / Notes
If the macro-enabled Excel file does not open
Some versions of Excel may block macro-enabled files for security reasons.
If the file does not open or the macros are disabled, please follow the steps below:
- Right-click the downloaded file and select Properties.
- Under the Security section, check Unblock.
- Reopen the file and enable macros when prompted.
For more details, refer to Microsoft’s official documentation:
https://learn.microsoft.com/en-us/microsoft-365-apps/security/internet-macros-blocked
Additional Notes
- You must enable macros for the auto-drawing feature to work properly.
- If you downloaded the sample version, delete the sample data before creating your own schedule.
- Public Holidays and Non-Working Days can be customized freely to match your country or organization.
How to Use
1.Download the template file.
Choose either the sample version or the blank version.
2.Set up “Assignees”, “Public Holidays”, and “Non-Working Days”.
Add or modify entries according to your team and country.
3.Select the project period.
Enter the overall start and end dates in the Schedule sheet.
4.Fill in your task details.
Enter information such as task name, assignee, start date, end date, progress (%), and status.
5.Choose a bar type for each task.
Select the visual style of each Gantt bar (e.g., Task, Phase).
6.Click the “Update” button to draw the chart.
The Gantt bars will be generated automatically based on your inputs.