Managing long-term projects often requires a different perspective from day-to-day task tracking.
A monthly Gantt chart is ideal for visualizing project timelines, milestones, and progress at a higher level.
This Excel template is designed for mid- to long-term planning, helping teams clearly understand priorities,
dependencies, and overall progress throughout the year.
What is a Gantt Chart?

A Gantt chart is a project management tool that visually represents a schedule over time.
Tasks, phases, or projects are displayed as bars along a timeline, making it easy to see start dates,
end dates, overlaps, and progress at a glance.
While daily or weekly Gantt charts focus on detailed task execution,
a monthly Gantt chart is better suited for strategic planning, roadmaps, and management-level reporting.
How to Use a Monthly Gantt Chart
Monthly Gantt charts are especially useful when you need a high-level view of multiple projects or initiatives.
This template divides each month into early, mid, and late periods, allowing flexible and intuitive planning.
- Annual or multi-quarter project roadmaps
- IT department or business unit planning
- Portfolio-level progress tracking
- Executive and management status reports
- Visual comparison of multiple projects or phases
Rules for Color and Arrow Samples
This template supports visual customization using cell colors and arrow objects.
These visual elements help communicate progress and relationships without relying on macros.
- Use background colors to distinguish projects, teams, or phases
- Apply consistent colors for progress or status categories
- Arrow objects can be used to indicate dependencies or flow between periods
- Keep color usage simple to maintain readability when printing
Key Features
Create a clean and professional Gantt chart
The template allows you to build a clear and visually balanced monthly Gantt chart suitable for presentations,
reports, and internal reviews.
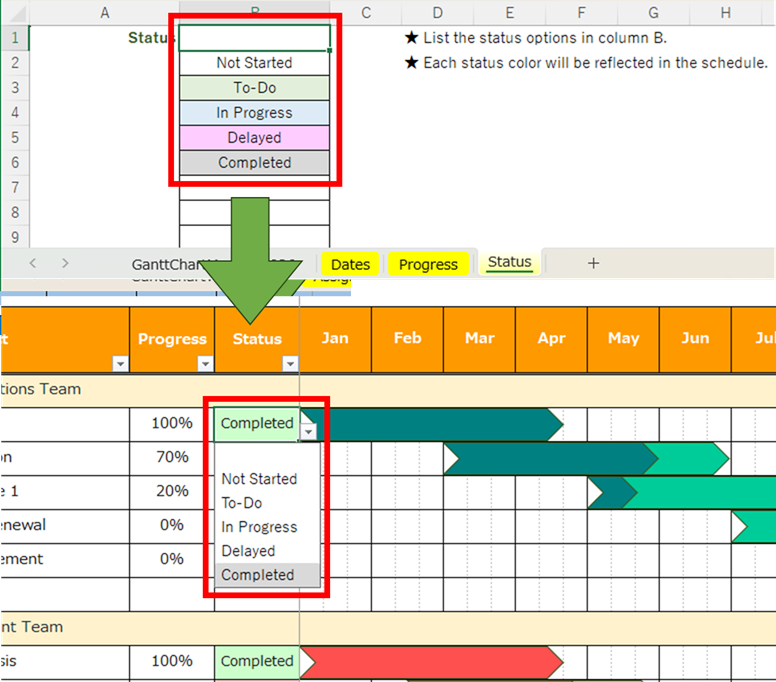
Built-in input support for Progress and Status
Progress and status values can be selected from predefined lists,
helping ensure consistency and reducing input errors.
English Excel Gantt Chart Templates
Looking for more Excel Gantt chart templates?
This page lists all English Gantt chart templates currently available on Excel-NEXT.
Each template is free to download and designed for practical project planning, from detailed schedules to high-level roadmaps.
Choose the format that best matches your planning needs.
-
Daily Gantt Chart (VBA Auto-Drawing)
A macro-enabled daily Gantt chart that automatically draws bars from schedule data for fast updates. -
Daily Gantt Chart (Manual, Macro-Free)
A simple, macro-free daily Gantt chart you can fill in manually—safe and easy to use in most work environments. -
Hourly Gantt Chart (Daily Time Schedule & Event Timetable)
An hourly Gantt-style schedule for daily planning, staff shifts, and event timetables with 30-minute time blocks. -
Weekly Gantt Chart (Manual, Macro-Free)
A weekly Gantt chart for tracking projects by week, ideal for short- to mid-term planning and reporting. -
Monthly Gantt Chart (Manual, Macro-Free)
A monthly roadmap-style Gantt chart with early/mid/late month blocks, suitable for long-term planning and portfolio views. -
Quarterly Gantt Chart (Annual Project Roadmap)
A quarterly Gantt chart with monthly blocks, designed for annual planning and high-level project roadmaps on a single page.
Tip: If you are new to Excel Gantt charts, start with a sample template first.
Sample data helps you quickly understand how to structure schedules and visualize timelines effectively.
Download
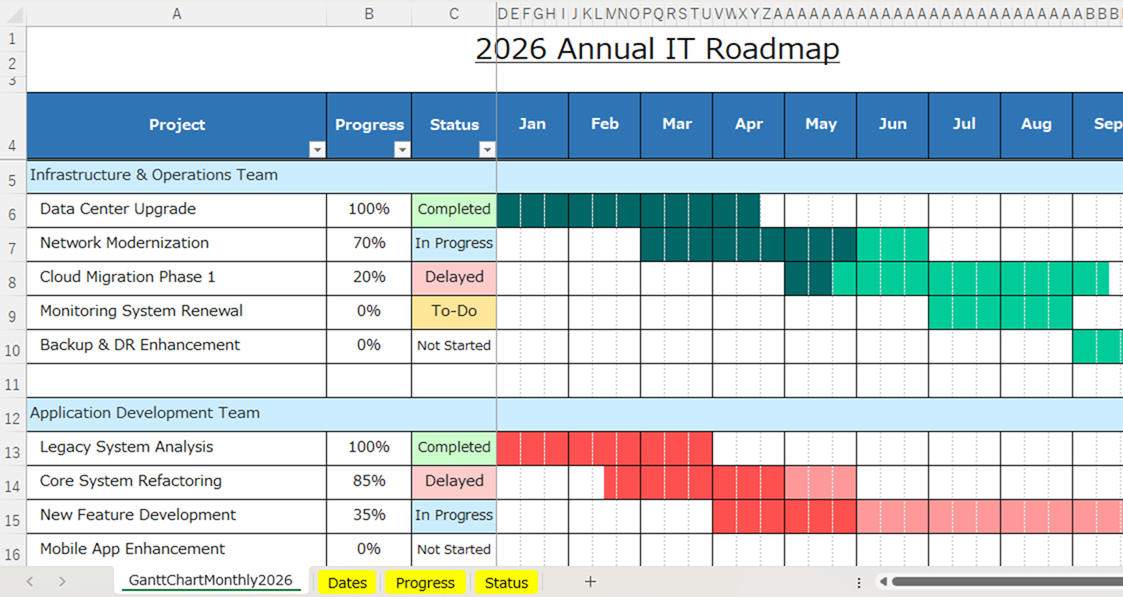
Sample Template | Color-Based Monthly Gantt Chart
A colorful sample using cell background colors to visualize project duration and progress.
Ideal for users who prefer simple and print-friendly designs.
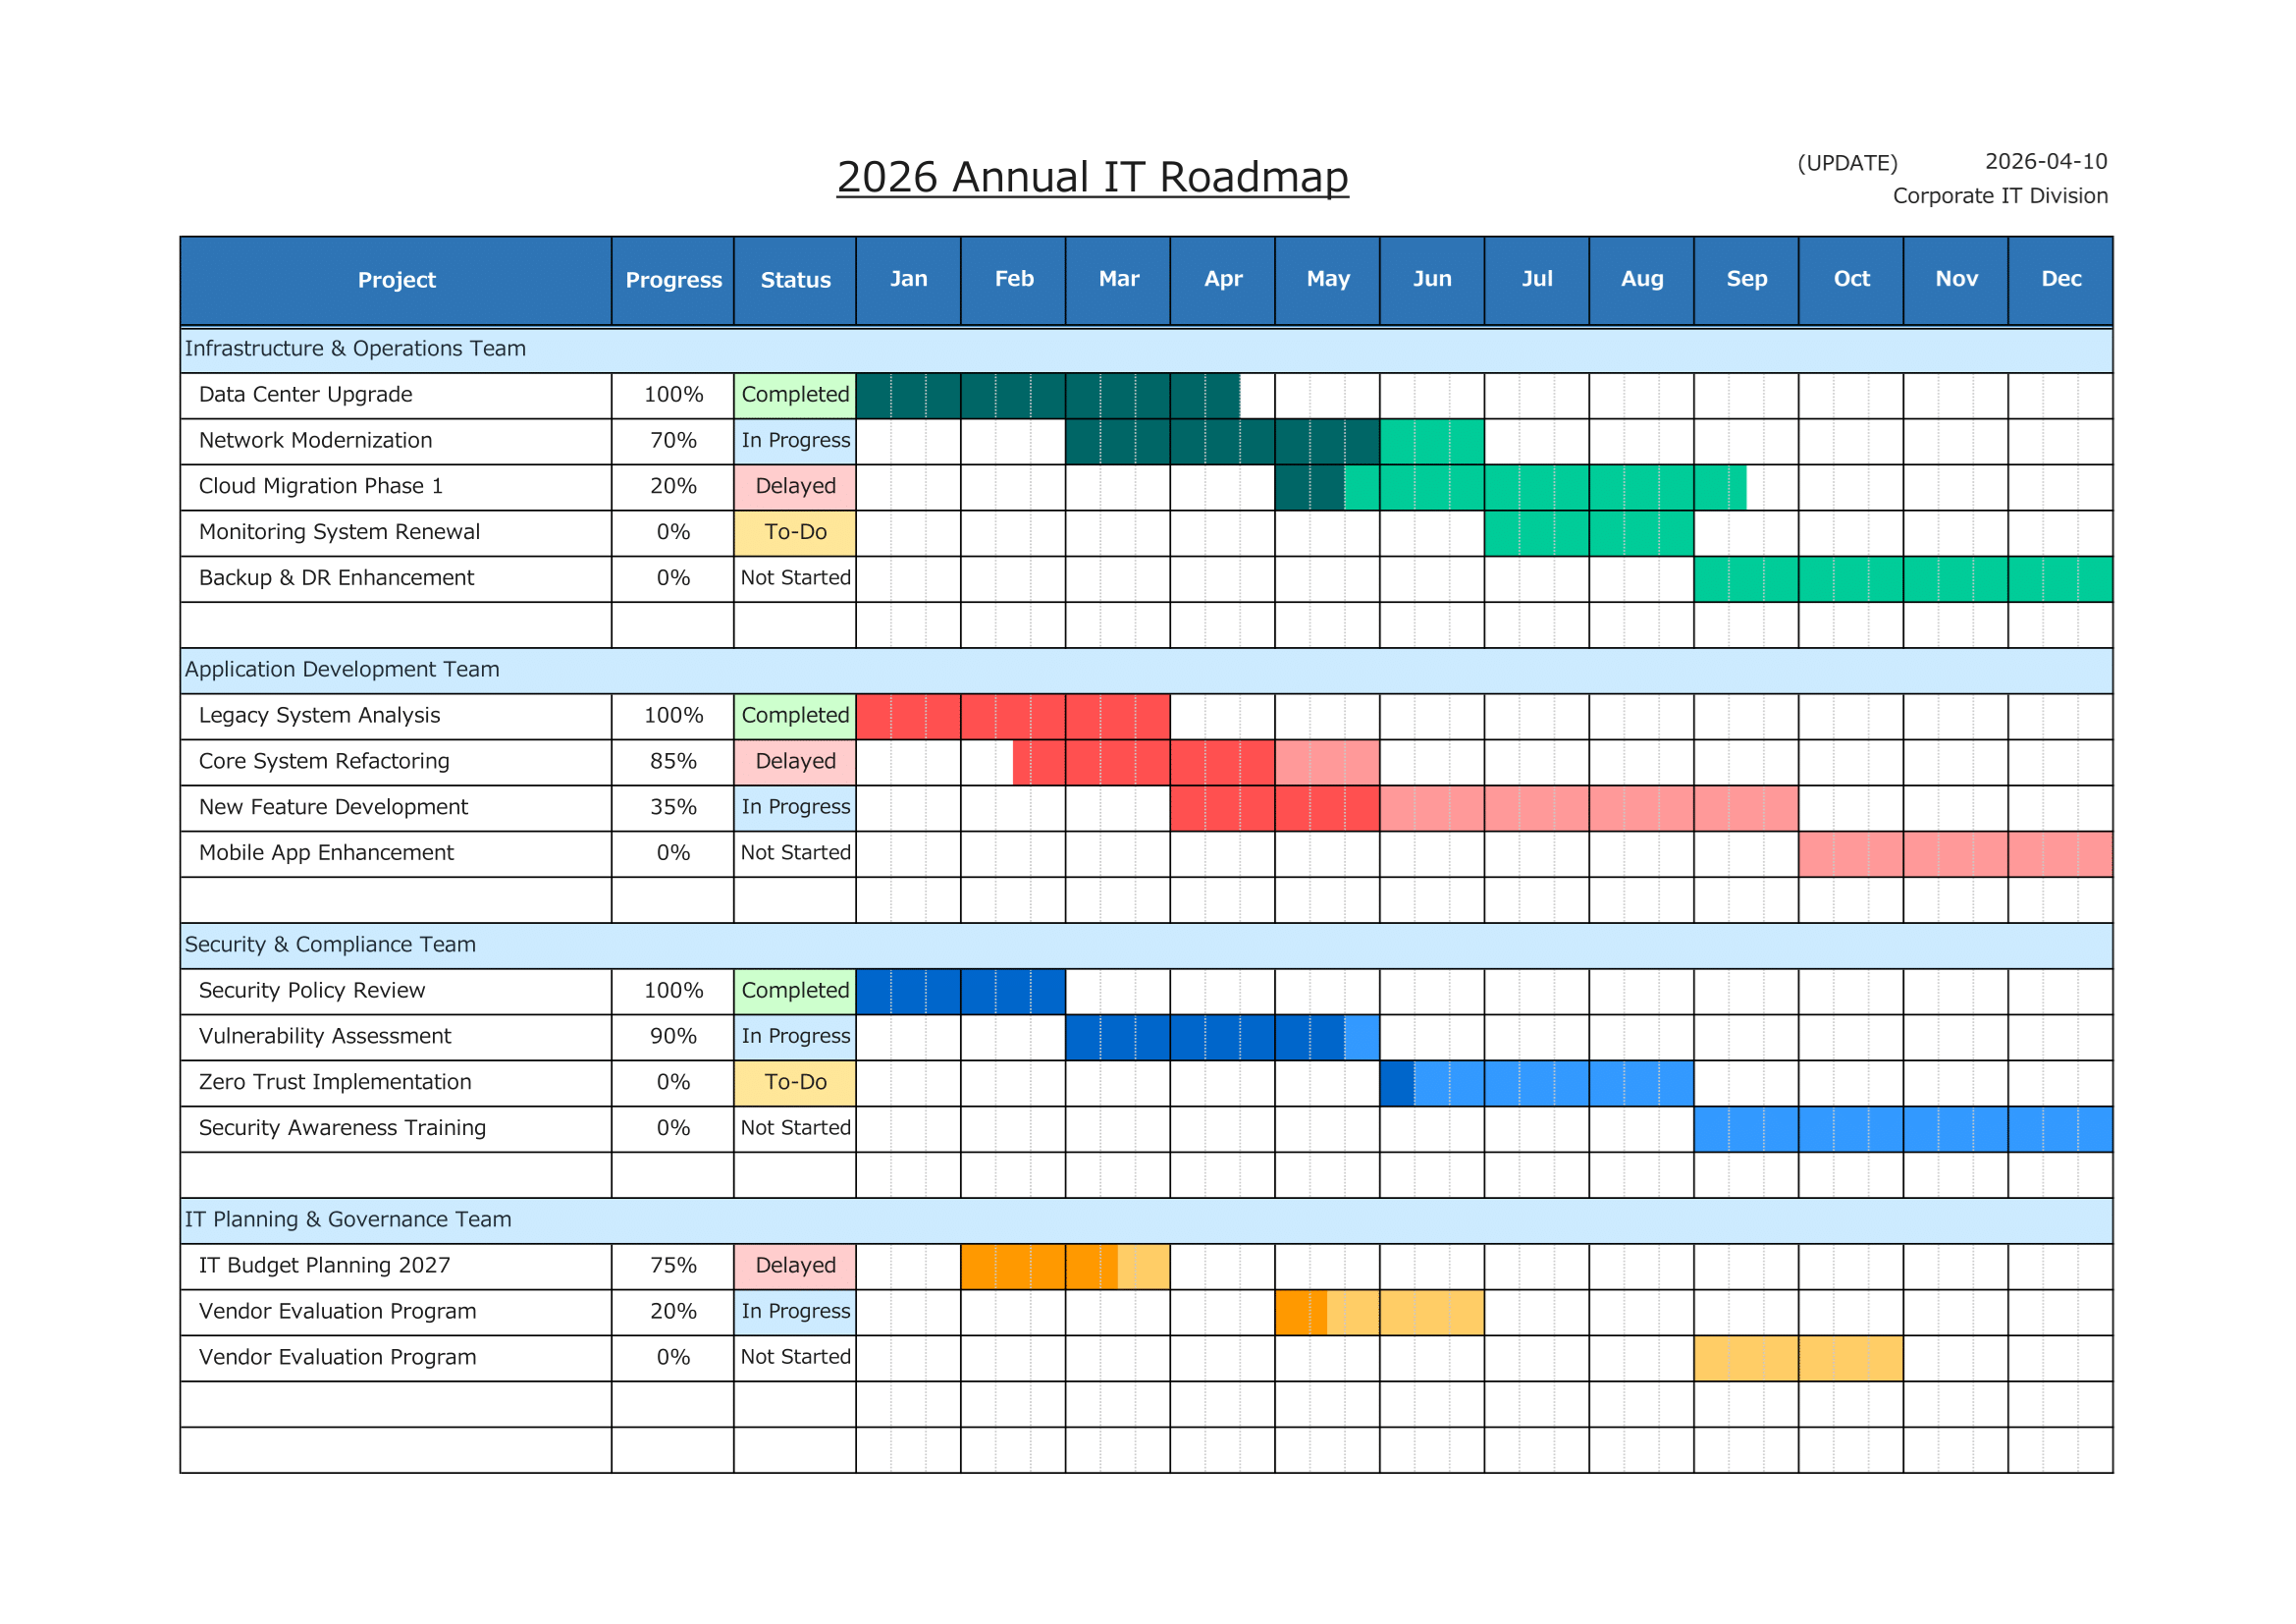
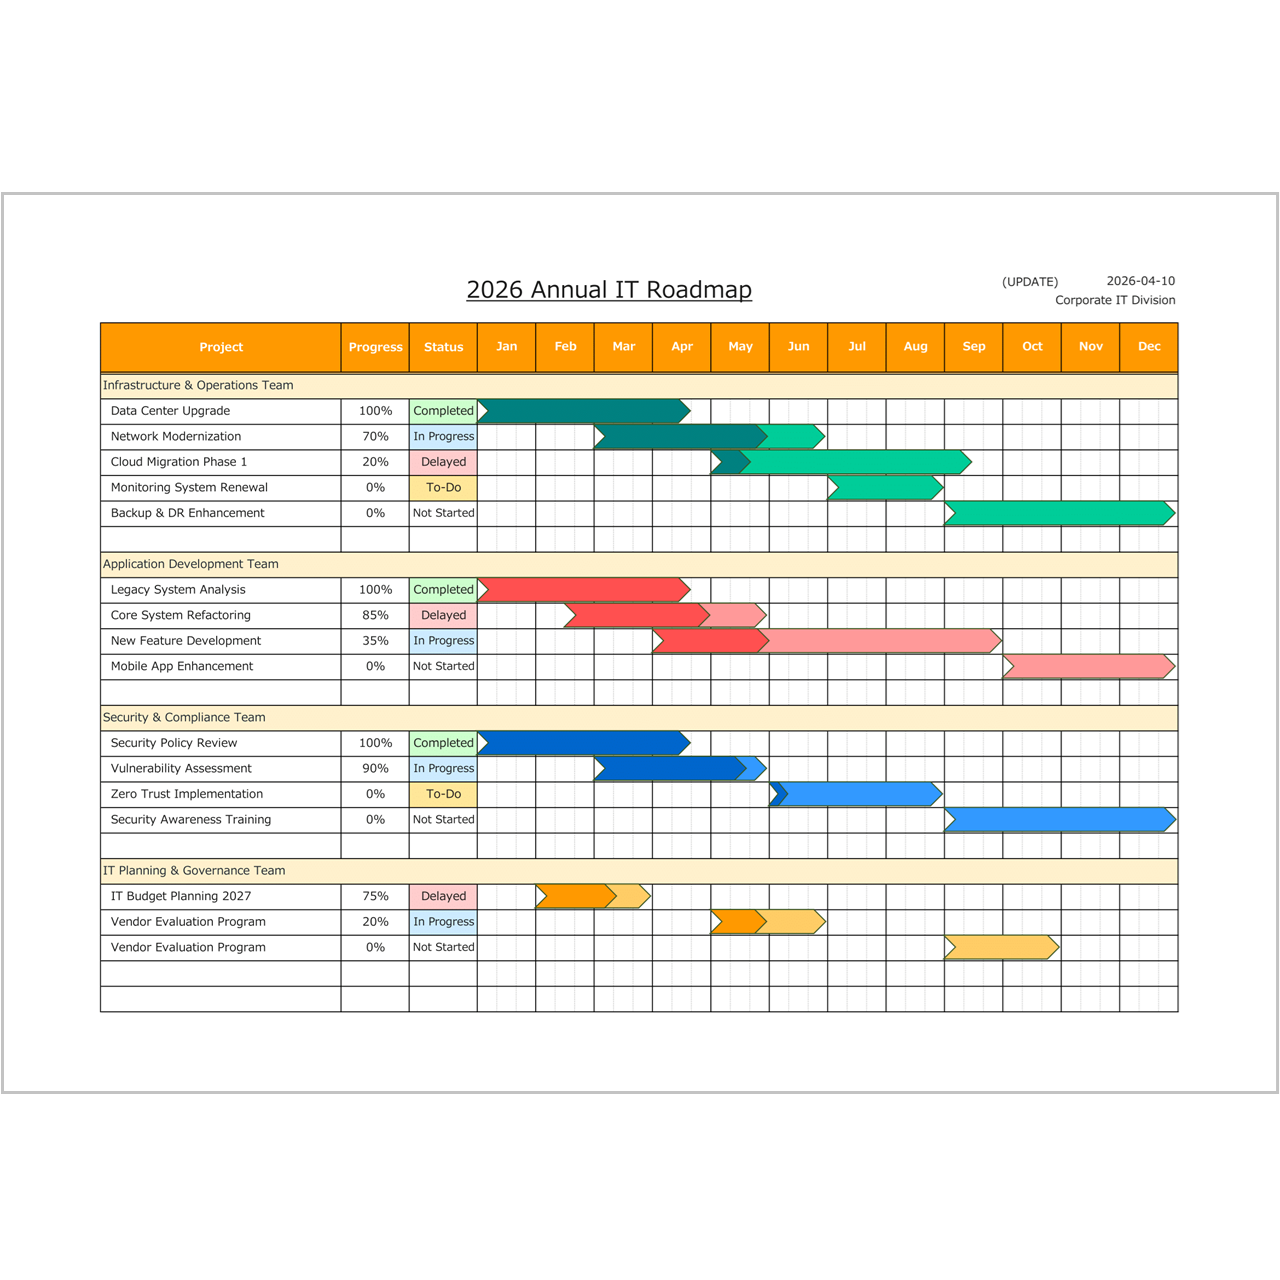
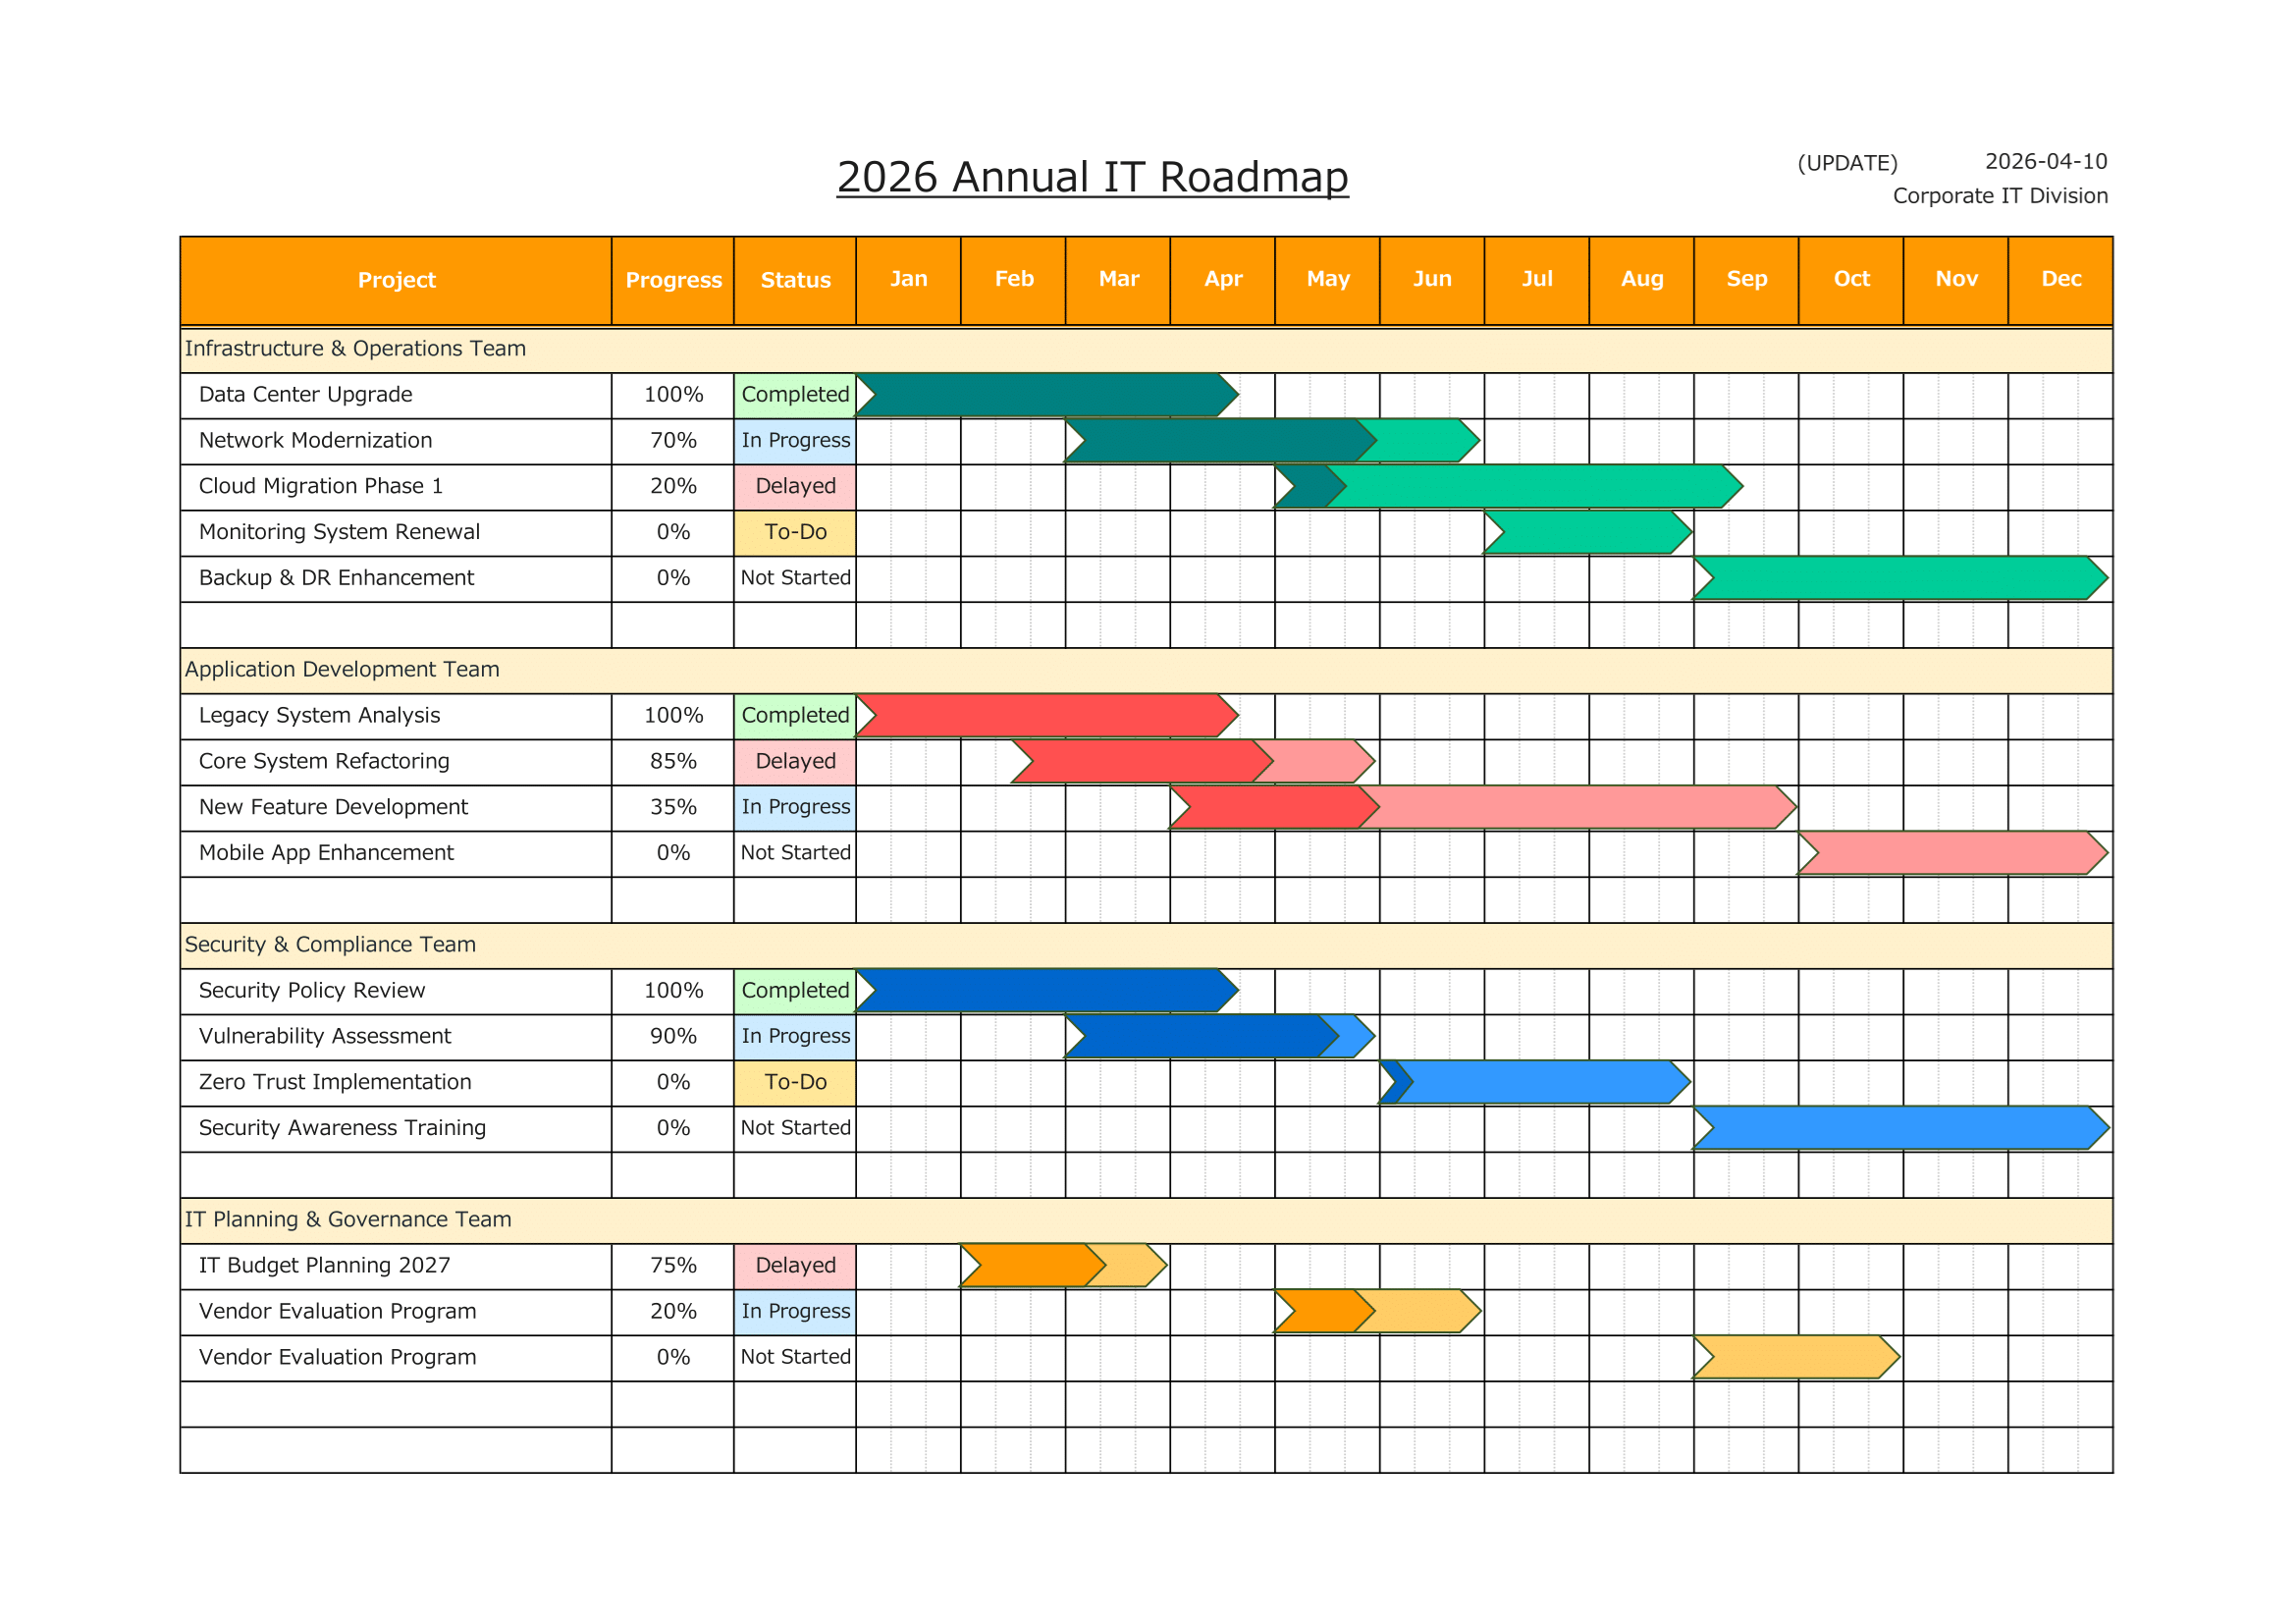
Sample Template | Arrow-Based Monthly Gantt Chart
A visually expressive sample using arrow objects to represent timelines and relationships between phases.
Useful for roadmap-style presentations.
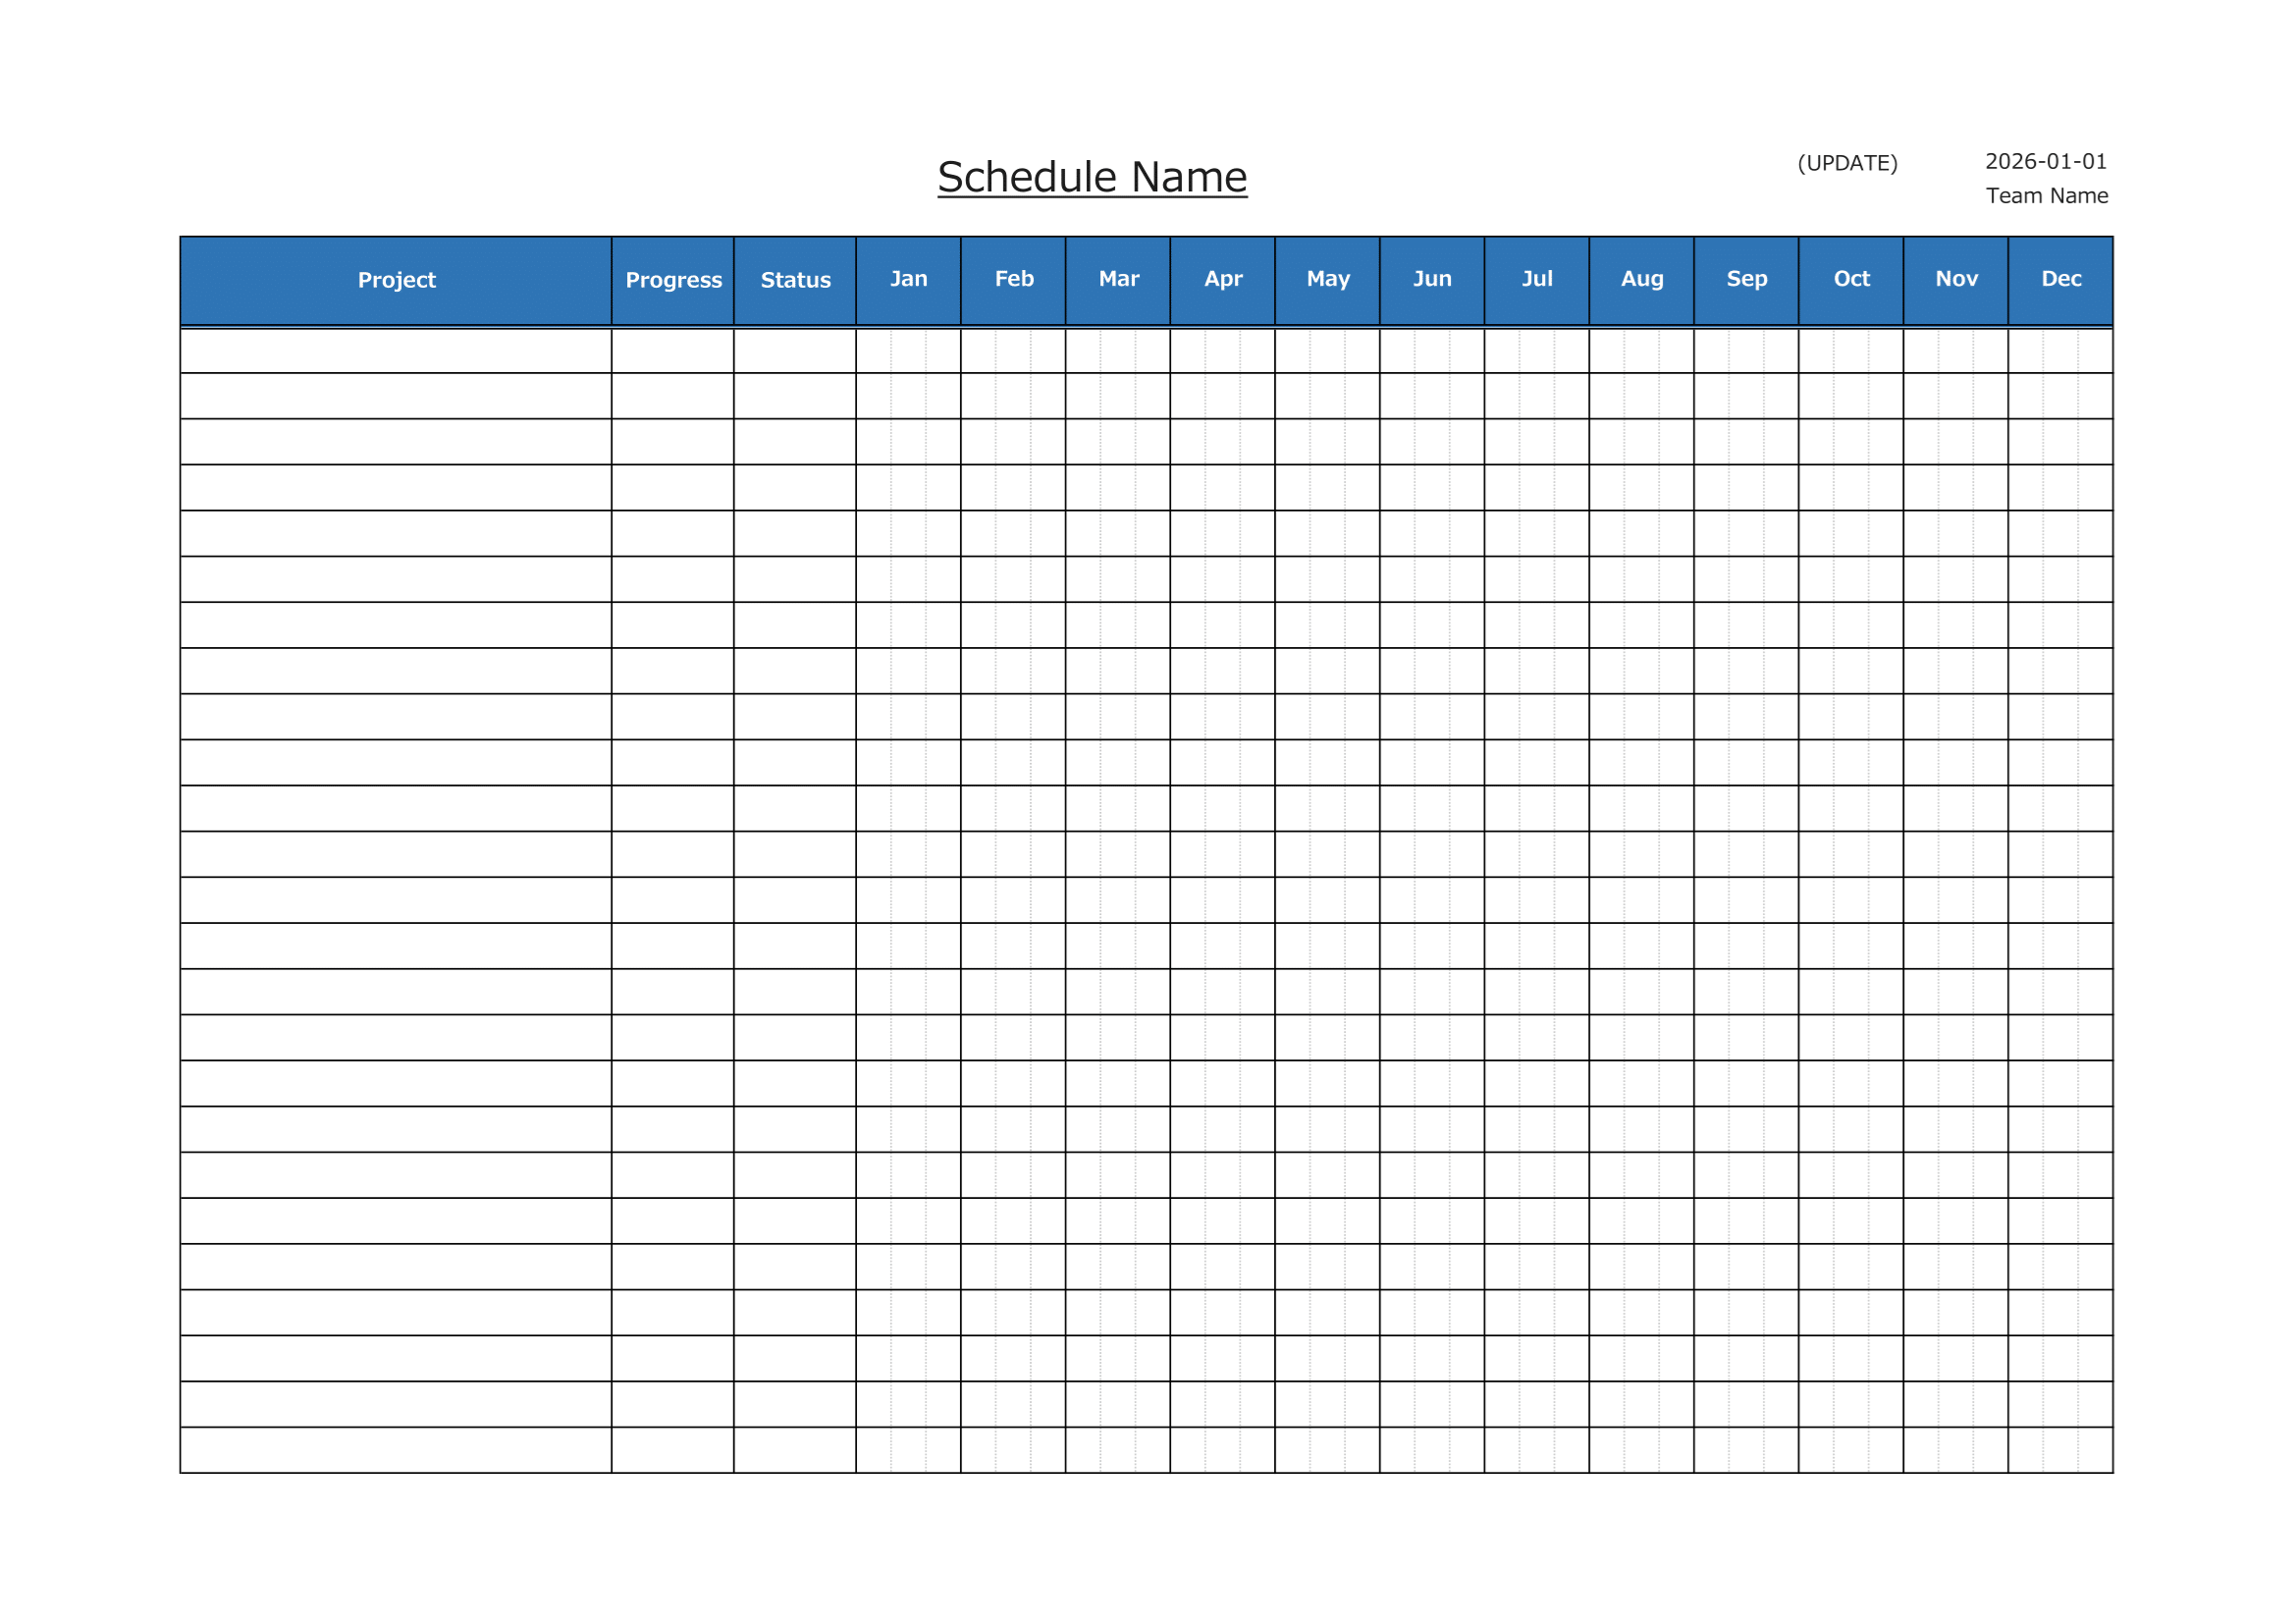
Blank Template
A clean, empty version of the monthly Gantt chart template.
Use this option if you want to start from scratch with your own projects and color rules.
⚠ Disclaimer
This template is provided as-is, without any warranties or guarantees of accuracy, reliability, or fitness for a particular purpose.
The creator assumes no responsibility for any losses or damages resulting from its use.
Redistribution, resale, or modification of this file for commercial purposes is strictly prohibited.
How to Use
- Download the Excel template file
- Enter the project or team names in the Project column
- Select the start and end periods for each project
- Choose Progress and Status values from the dropdown lists
- Fill in the chart area using colors or arrow objects
- Adjust formatting as needed and print or share the chart
This macro-free Excel Gantt chart is safe, flexible, and suitable for a wide range of business and IT planning scenarios.